Datacap pages cut from seconds to milliseconds.
A tier-one retail bank’s IBM Datacap workflow had become painful to use. Every action in the Datacap Navigator Plugin — opening a batch, panning the document viewer, clicking a dropdown — took several seconds, with no obvious culprit on the server. Hardware was healthy, the database was fast, and the network team had signed off on the link. We were called in to find the cause and stabilise it.
Every action in the workflow paused for several seconds.
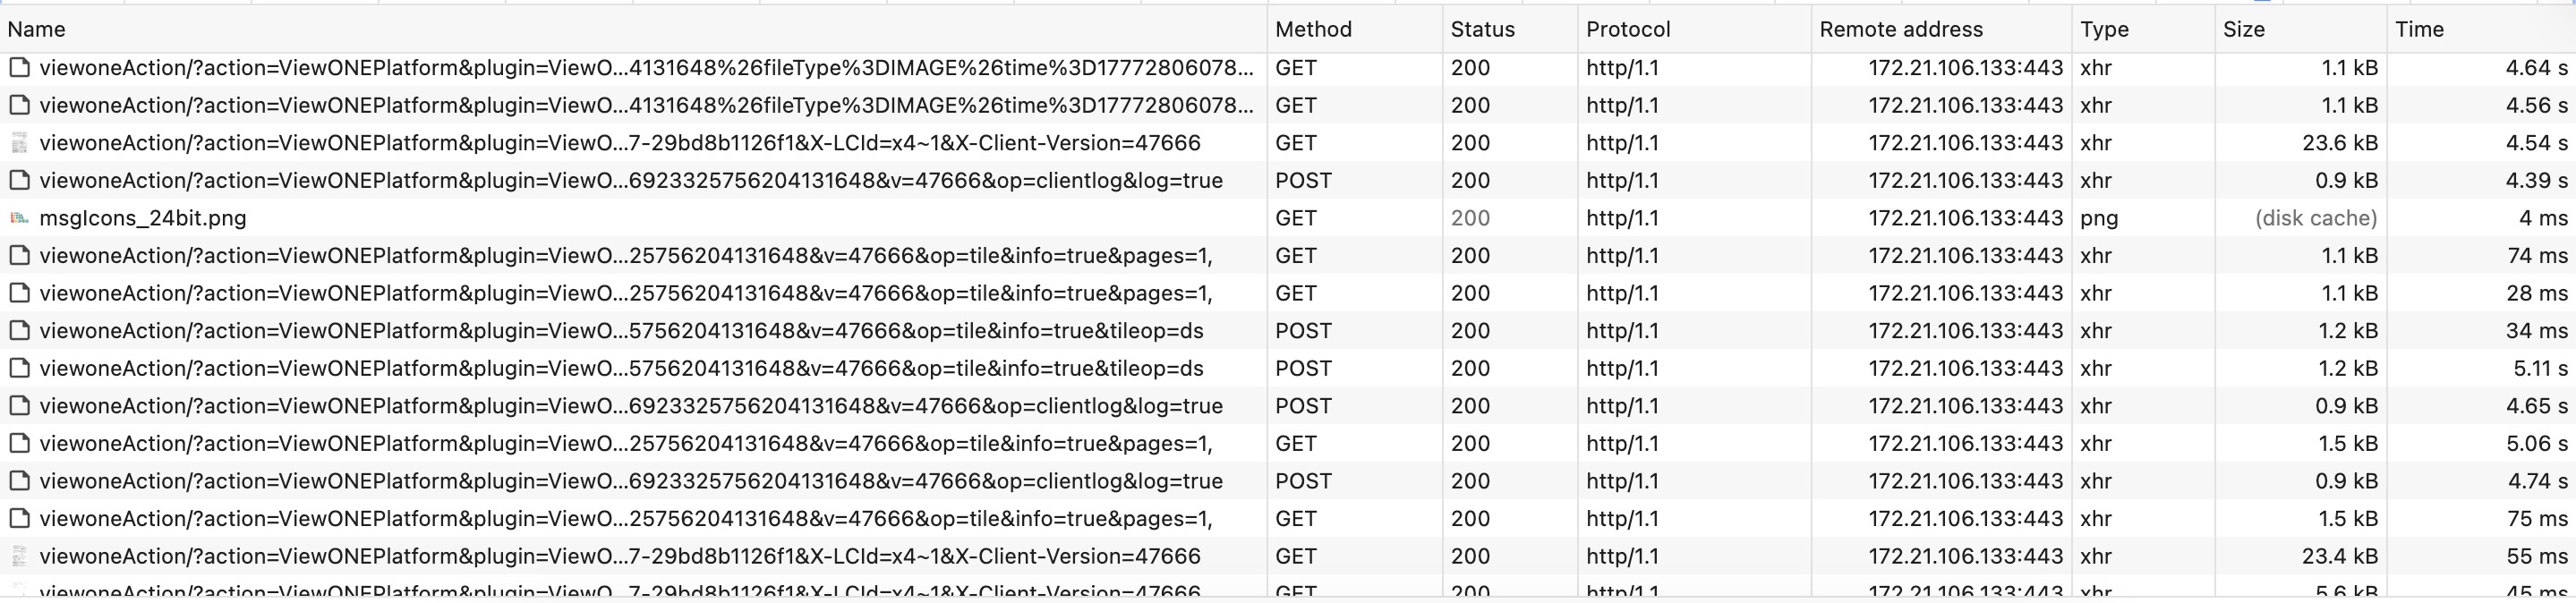
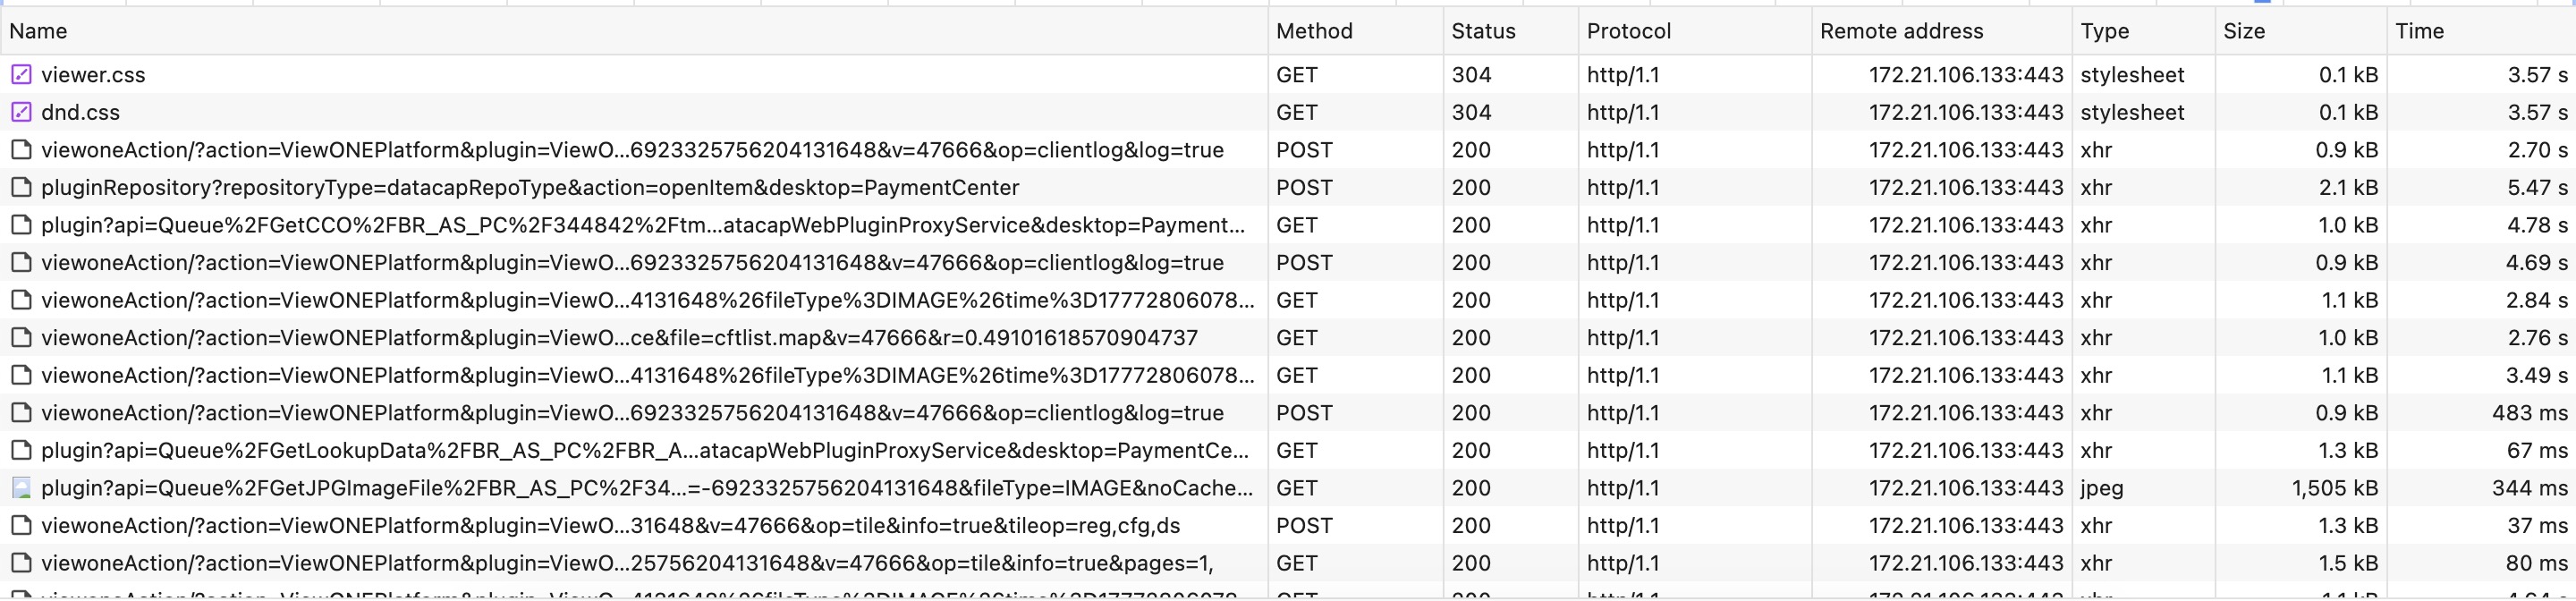
A browser HAR capture across a typical session showed 144 requests totalling 455 seconds — with 96% of that time spent in wait (server time-to-first-byte). Heavy 1.4 MB image fetches returned in 350 ms, but a 76-byte acknowledgement to a saveFile call took 15 seconds. The pattern had nothing to do with payload size; it was a uniform per-request overhead being added somewhere on the server side.
A lock convoy inside the logger, fed by a 5-second DNS timeout.
The HAR ruled out the network, the database, and payload size — 96% of total time was server-side time-to-first-byte, and the wait floor was a suspiciously clean ~5 seconds. We asked the team to capture eight Java thread dumps on the WebSphere JVM hosting IBM Content Navigator, taken five seconds apart while the slowness was being reproduced.
The dumps were decisive. In six of the eight, a single WebContainer thread held the global com/ibm/ejs/ras/SystemOutStream monitor — the JVM-wide lock the WAS logger acquires for every write — and was stuck in the same native frame: java/net/Inet6AddressImpl.getHostByAddr, called from InetAddress.getCanonicalHostName(), called from RasHelper.getFullHostName(), called from SystemOutStream.logRolled(). WAS was rotating its SystemOut.log, writing the new file's header, and resolving the host’s own IP back to an FQDN to put in that header — a reverse DNS lookup on itself. Behind that one thread, fourteen to twenty‑one other WebContainer threads were queued on the same monitor, every one of them coming through NavigatorContext.<init> → Logger.logDebug. Every JAX-RS request to ICN — CSS, JS, AJAX, image fetches, even 304 Not Modified responses — goes through that constructor. So while one thread sat in DNS, every user-facing request piled up behind it.
That is a textbook lock convoy: a fast lock made slow because the code holding it is waiting on something off-process. It also explained every prior puzzle — the bursty pattern (fast → 5 s stall → fast, in line with log‑rollover events), why static and database paths were equally affected (all paths log), and why the WebContainer pool looked under-utilised in Tivoli (the bottleneck was the lock, not the pool).
A targeted Wireshark capture confirmed the DNS hypothesis on the wire. The server had two NICs. The primary interface carried all real application traffic. A second interface, Ethernet2, held the address 172.21.113.130 and had no DNS server configured. Reverse-lookup queries that landed on that interface had nowhere to go and waited out the full 5-second OS resolver timeout before failing — the exact 5-second floor the HAR had been showing all along.
A few lines in the hosts file.
The fastest, lowest-risk remediation was to short-circuit the resolver. We added entries to the Windows hosts file on the WAS server mapping every IP the host owns — both NICs — to its canonical FQDN. With that in place, getCanonicalHostName() returns from the local file in microseconds and never touches DNS, so the log-rollover thread can no longer stall holding the logger monitor. No JVM restart, no application change, no network ticket — a contained, reversible edit aligned with IBM’s own documented mitigation for this WebSphere behaviour. Longer-term hardening (a JVM property to skip the FQDN resolution, reducing ICN debug-trace volume, and a proper PTR record from the network team) was scheduled for the next maintenance window.
Page response dropped to under 30 ms.
After the hosts file change, every page in the workflow rendered in well under 30 ms. Follow-up thread dumps were clean — no thread anywhere in the stack of getCanonicalHostName or RasHelper.getFullHostName, no waiters on the SystemOutStream monitor — and the 5-second deltas in the Wireshark trace were gone. The fix held through subsequent peak cycles without intervention, the marker we use for a problem genuinely solved rather than temporarily relieved.
Seconds → < 30 ms
Per-page response time, end-to-end, on the same hardware.
Two lines
A static hosts file edit on a single server — no application or infrastructure change.
Same day
From HAR and Wireshark evidence to verified production fix, contained to one maintenance touch.